Power BI Project: Supply Chain Analytics Dashboard
Supply Chain Analytics
Key Insights
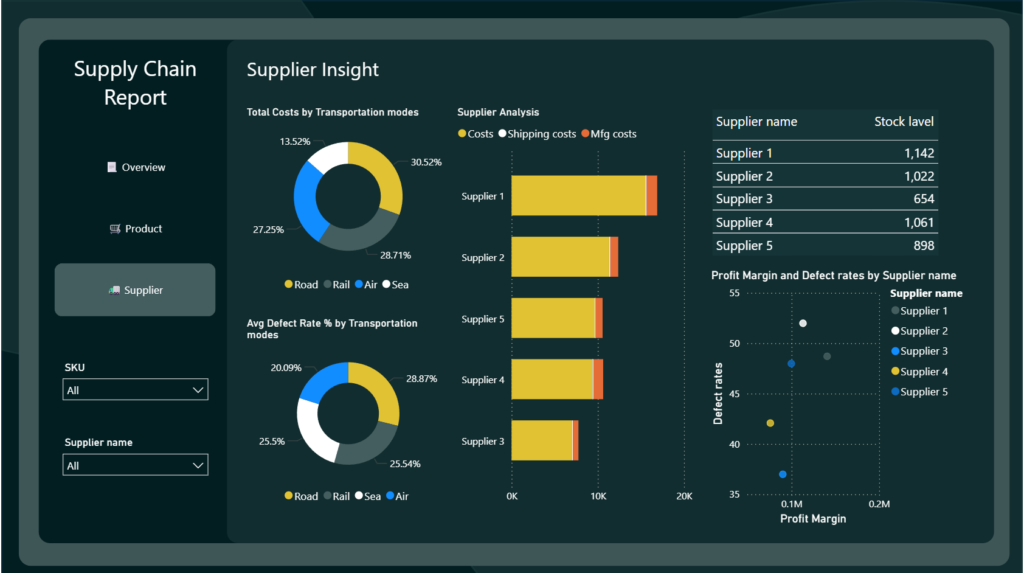
📊 Total Costs by Transportation Mode → Road, Rail, Air, Sea
🏭 Supplier Analysis → Costs, Shipping, and Manufacturing costs
📦 Stock Levels by Supplier
⚡ Defect Rates vs. Profit Margins → Supplier performance comparison
🚚 Avg. Defect Rates by Transportation Mode
🛠 Tools & Skills Used:
Power BI Desktop
Data modeling & DAX
Map visuals and slicers
Custom KPIs and charts
Year
2025
Client
Freelance Project
Services
Data analyze
Project
Dashboard Creation
Description
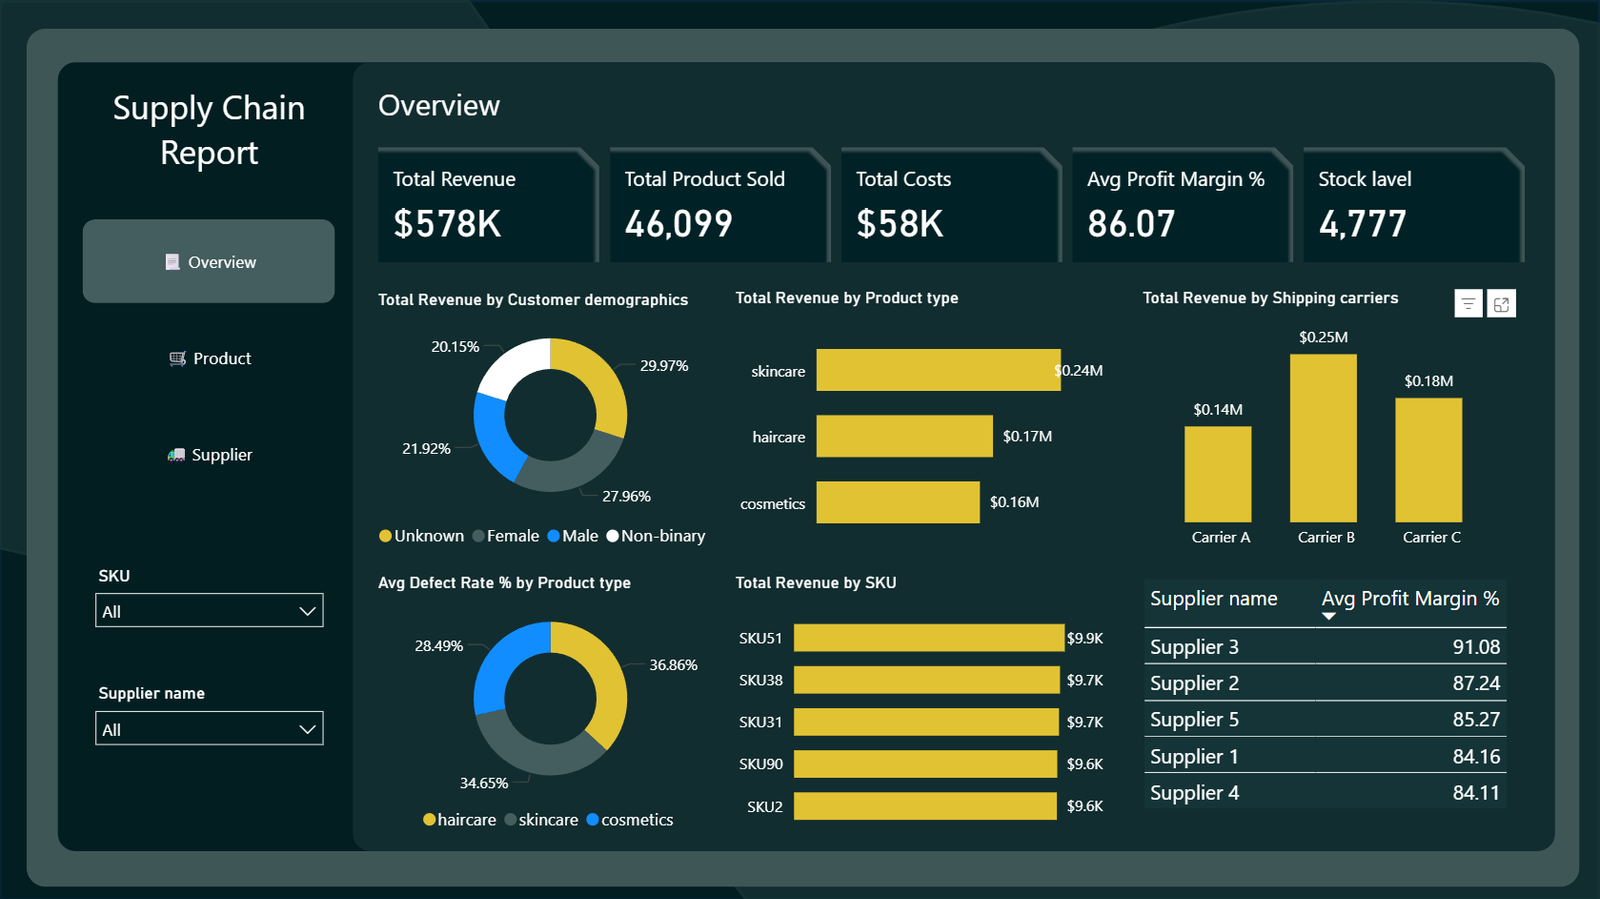
This dashboard was built in Power BI using raw supply chain data to analyze supplier performance, transportation costs, and stock management. It provides businesses with actionable insights for optimizing supplier costs, defect rates, and profit margins.

 Supply Chain Analytics