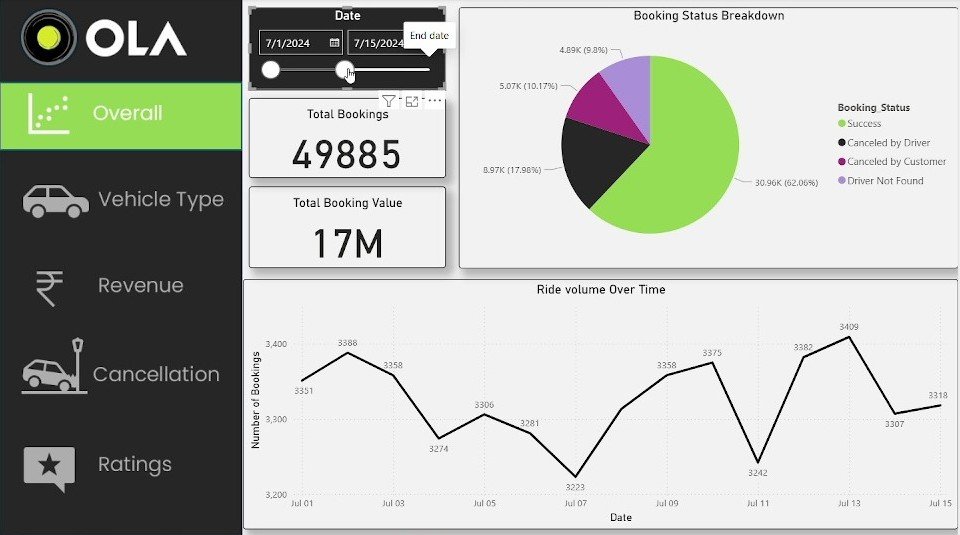
Overall Ride Trends: Ride volume over time and booking status distribution.
Vehicle Insights: Top 5 vehicle types by ride distance and customer ratings per vehicle type.
Revenue Analysis: Revenue by payment method, top 5 customers by booking value, and ride distance patterns per day.
Cancellation Insights: Common reasons for ride cancellations by customers and drivers.
Ratings Overview: Distribution of driver ratings and comparison between customer & driver ratings.
🛠 Tools & Skills Used:
Power BI Desktop
Data modeling & DAX
Map visuals and slicers
Custom KPIs and charts
Data cleaning & transformation
visualization design
KPI development,
business analytics
storytelling with data.
Year
2025
Client
Freelance Project
Services
Data analyze
Project
Dashboard Creation
Description
This interactive dashboard, developed in Microsoft Power BI, provides deep insights into OLA ride operations, revenue patterns, customer behavior, and service quality. It integrates multiple datasets, applies advanced DAX calculations, and uses a variety of visualizations — including time-series charts, bar charts, pie charts, scatter plots, and histograms — to uncover trends and highlight key business metrics. The dashboard empowers decision-makers to monitor performance, identify improvement opportunities, and make data-driven strategic choices.

 ola rides analytics dashboard