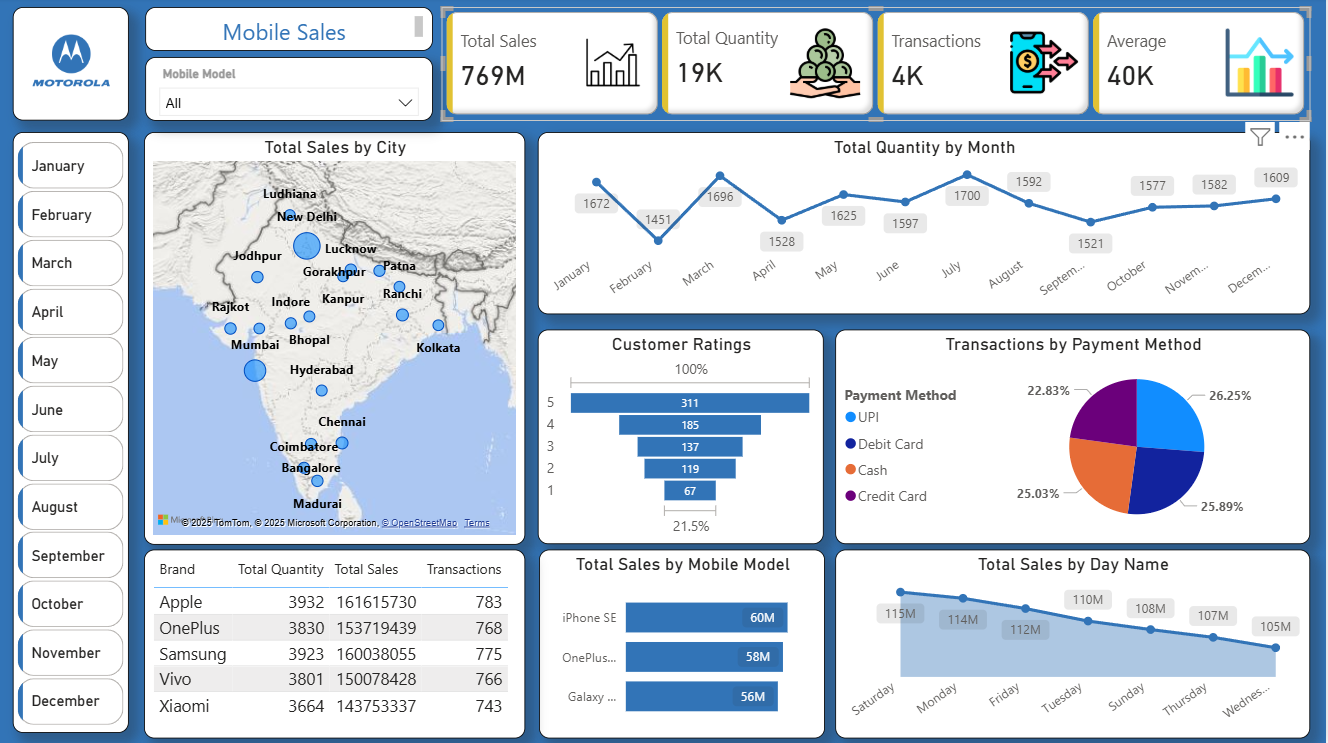
✅ ₹769M+ in total sales ✅ 19K+ units sold across 4,000 transactions ✅ Top-selling brands like Apple, Samsung, OnePlus ✅ Monthly sales trends and customer satisfaction ratings ✅ Interactive map for city-wise sales performance ✅ Analysis by payment method and day of the week ✅ Dynamic filtering by month and mobile mode
🛠 Tools & Skills Used:
Power BI Desktop
Data modeling & DAX
Map visuals and slicers
Custom KPIs and charts
Year
2025
Client
Freelance Project
Services
Data analyze
Project
Dashboard Creation
Description
I created this Mobile Sales Dashboard using Microsoft Power BI to visualize and analyze sales data across different cities, brands, and time periods. The dashboard provides clear insights into total sales, quantity sold, customer ratings, and transaction methods. It features interactive filters for months and mobile models, a geographic sales map, and visual breakdowns of top-performing brands and payment trends. This project demonstrates my skills in data modeling, DAX, and interactive dashboard design, aimed at helping businesses make data-driven decisions quickly and effectively.

 Mobile sales dashboard